ABSTRACT
CTR estimation for rare events is essential but challenging, often incurring with huge variance, due to the sparsity in data
INTRODUCTION
large fraction of Internet traffic while the overwhelming counterparts are extremely rare events
BACKGROUND
for a given page/ad pair (p, a), with the number of impressions (I) and clicks (C)
the standard estimation of CTR as C/I is inevitably unreliable
Data Hierarchies
$r_i = (C_i + \alpha) / ( I_i + \alpha + \beta)$
Data Continuity
$\hat{C_j} = C_j; j = 1$
$\hat{C_j} = \gamma C_j + (1 - \gamma) C_{j - 1}; j = 2,\dots,M$
where $\gamma$is the smoothing factor, and 0 < $\gamma$ < 1
that is often less effective
we can first do exponential smoothing on impressions and clicks before leveraging the data hierarchy to combine two smooth method together
SMOOTHING CTR ESTIMATION
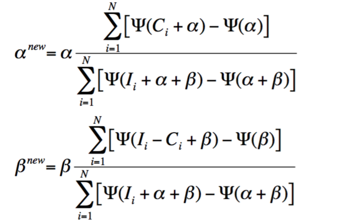
Leveraging Data Hierarchies with Empirical Bayes Methods
Two assumptions:
- for each publisher/account pair, there is an underlying/unknown probability distribution of CTR, and the CTR of every page/ad pair in the publisher/account pair could be regarded a stochastic outcome of the distribution
- for every page/ad pair, we observe the impressions and clicks generated from a distribution of the CTR of this pair
The maximum can be calculated through the fixed-point iteration

stopping criterion
- 1000 iterations
- changes in both $\alpha, \beta$ are smaller than 1E-10
smoothed ctr:
Utilizing Event History with Exponential Smoothing

Combining Data Hierarchies and Temporal Smoothing
better performance than each individual model alone
EXPERIMENTAL RESULTS
Evaluation Metrics
$r$ and $\hat{r}$ are the true CTR and the estimated CTR respectively
MSE

KL-divergence

when $r$ or $\hat{r}$ are in extreme values (0 or 1) $D_{kl}$ is not well defined. ignore it
MSE and the average KL divergence in general agree
Experiments
- all the page/ad pairs we consider in this chapter have at least 10,000 impressions
- exclude the publisher/account pairs that do not have at least 10 page/ad pairs
Results on Smoothing with Data Hierarchies

the more sparser data is the more dramatic effect is
Results on Temporal Exponential Smoothing

autohome CTR frame
use posterior features + gbdt
| func | test AUC |
|---|---|
| hierarchy smooth | 0.664616 |
| def value($\alpha=10,\beta=50$) | 0.664404 |
| no smooth | 0.664340 |
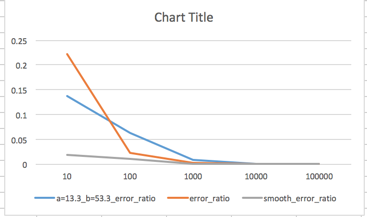
Results on manual data
compare:
- no smooth
- smooth with fixed value
- smooth with calculate value

as we can see, when tiny sample fixed value smooth is better than no smooth. but if we have hundred samples or larger, fixed value smooth get worse result.